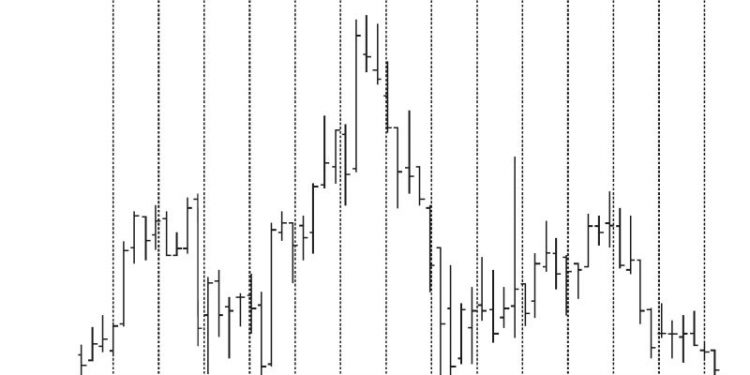
In the realm of market research and analysis, technical indicators play a crucial role in providing insights into market trends and potential future price movements. In this article, we delve deeper into the world of technical indicators, exploring their significance, types, and practical applications in making informed trading decisions.
Understanding Technical Indicators
Technical indicators are mathematical calculations based on the historical price, volume, or open interest of a security or market index. These indicators help traders and investors analyze and interpret market data to identify potential trading opportunities. By using technical indicators, market participants can gain insights into the strength, direction, volatility, and momentum of the market.
Types of Technical Indicators
There are various types of technical indicators, each serving a distinct purpose in market analysis. Some of the common categories of technical indicators include trend-following indicators, momentum indicators, volatility indicators, and volume-based indicators.
Trend-following indicators, such as moving averages and trendlines, help traders identify the direction of a market trend and the potential reversal points.
Momentum indicators, such as the Relative Strength Index (RSI) and Stochastic Oscillator, provide insights into the speed and strength of price movements, helping traders gauge the overbought or oversold conditions of a security.
Volatility indicators, such as Bollinger Bands and Average True Range (ATR), measure the degree of price fluctuations in the market, enabling traders to adjust their risk management strategies accordingly.
Volume-based indicators, such as On-Balance Volume (OBV) and Chaikin Money Flow (CMF), analyze the trading volume of a security to confirm price trends and forecast potential reversals.
Practical Applications of Technical Indicators
Technical indicators can be applied in various ways to enhance market research and analysis. Traders often use a combination of different indicators to confirm signals and make more informed trading decisions. For instance, a trader may use a moving average crossover strategy in conjunction with the RSI indicator to enter or exit trades based on the alignment of multiple signals.
Moreover, technical indicators can also be used to set stop-loss levels, identify support and resistance levels, and generate trading signals based on specific criteria. By integrating technical indicators into their trading strategies, market participants can improve their risk management practices and increase their chances of profitability in the market.
Conclusion
Technical indicators serve as valuable tools in market research and analysis, providing traders and investors with meaningful insights into market trends and price movements. By understanding the significance of technical indicators, exploring different types of indicators, and applying them in practical trading scenarios, market participants can enhance their decision-making processes and achieve greater success in the financial markets.


